Useful resources about breathing, phytonutrients and exercise
Posted: June 30, 2021 Filed under: behavior, Breathing/respiration, cancer, Evolutionary perspective, health, Nutrition/diet, self-healing, Uncategorized | Tags: diet, exercise, immune system, nasal breathing, phytonutrients, respiration 1 Comment
Dysfunctional breathing, eating highly processed foods, and lack of movement contribute to development of illnesses such as cancer, diabetes, cardiovascular disease and many chronic diseases. They also contributes to immune dysregulation that increases vulnerability to infectious diseases, allergies and autoimmune diseases. If you wonder what breathing patterns optimize health, what foods have the appropriate phytonutrients to support your immune system, or what the evidence is that exercise reduces illness and promotes longevity, look at the following resources.
Breath: the mind-body connector that underlies health and illness
Read the outstanding article by Martin Petrus (2021). How to breathe.
https://psyche.co/guides/how-to-breathe-your-way-to-better-health-and-transcendence
You are the food you eat
Watch the superb webinar presentation by Deanna Minich, MS., PHD., FACN, CNS, (2021) Phytonutrient Support for a Healthy Immune System.
Movement is life
Explore the summaries of recent research that has demonstrated the importance of exercise to increase healthcare saving and reduce hospitalization and death.
Reduce initial dose of the virus and optimize your immune system
Posted: April 4, 2020 Filed under: behavior, health, stress management, Uncategorized | Tags: coronavirus, COVID-19, immune system, public health, technology 9 CommentsErik Peper and Richard Harvey
Adapted from:Peper, E. & Harvey, R. (September 13, 2020). Reduce Initial Dose of the Virus and Optimize Your Immune System. Townsend Letters-The Examiner of Alternative Medicine, 44. https://www.townsendletter.com/article/reduce-initial-dose-of-the-virus-and-optimize-your-immune-system/
COVID-19 can sometimes overwhelm young and old immune systems and in some cases can result in ‘Severe Acute Respiratory Syndrome’ pneumonia and death (CDC, 2020). The risk is greater for older people, and people with serious heart conditions (e.g., heart failure, coronary artery disease, or cardiomyopathies), cancers, obesity, Type 2 diabetes, COPD, chronic kidney disease, hypertension, smoking, immune suppression or other health issues (CDC, 2020a) as well as young people who vape or smoke and those with immunological defects in type I and II interferon production (Gaiha, Cheng, & Halpern-Felsher, 2020; van der Made, 2020). As we age the immune system deteriorates (immunosenescence) that reduces the response of the adaptive immune system that needs to respond to the virus infection (Aw, Silva & Palmer, 2007; Osttan, Monti, Gueresi, et al., 2016). On the other hand, for young people and children the risk is very low and similar for Covid-19 as for seasonal influenza A and B in rates for hospitalization, admission to the intensive care unit, and mechanical ventilator ( Song et al, 2020).
Severity of disease may depend upon initial dose of the virus
In a brilliant article, How does the coronavirus behave inside a patient? We’ve counted the viral spread across peoples; now we need to count it within people, assistant professor of medicine at Columbia University and cancer physician Siddhartha Mukherjee points out that severity of the disease may be related to the initial dose of the virus. Namely, if you receive a very small dose (not too many virus particles), they will infect you; however, the body can activate its immune response to cope with the infection. The low dose exposure act similar to vaccination. If on the other hand you are exposed to a very high dose then your body is overwhelmed with the infection and is unable to respond effectively. Think of a forest fire. A small fire can easily be suppressed since there is enough time to upgrade the fire-fighting resources; however, during a fire-storm with multiple fires occurring at the same time, the fire-fighting resources are overwhelmed and there is not enough time to recruit outside fire-fighting resources.
As Mukherjee points out this dose exposure relationship with illness severity has a long history. For example, before vaccinations for childhood illnesses were available, a child who became infected at the playground usually experienced a mild form of the disease. However, the child’s siblings who were infected at home develop a much more severe form of the disease.
The child infected in the playground most likely received a relatively small dose of the virus over a short time period (viral concentration in the air is low). On the other hand, the siblings who were infected at home by their infected brother or sister received a high concentration of the virus over an extended period which initially overwhelmed their immune system. Higher virus concentration is more likely during the winter and in well insulated/sealed houses where the air is recirculated without going through HEPA or UV filters to sterilize the air. When there is no fresh air to decrease or remove the virus concentration, the risk of severity of illness may be higher (Heid, 2020).
The risk of becoming sick with COVID-19 can only occur if you are exposed to the coronavirus and the competency of your immune system. This can be expressed in the following equation. This equation suggests two strategies to reduce risk: reduce coronavirus load/exposure and strengthen the immune system.
How to reduce the coronavirus load/dose of virus exposure
Assume that everyone is contagious even though they may appear healthy. Research suggests that people are already contagious before developing symptoms or are asymptomatic carriers who do not get sick and thereby unknowingly spread the virus (Furukawa, Brooks, Sobel, 2020). Dutch researchers have reported that, “The proportion of pre-symptomatic transmission was 48% for Singapore and 62% for Tianjin, China (Ganyani et al, 2020). Thus, the intervention to isolate people who have symptoms of COVID-19 (fever, dry cough, etc.) most likely will miss the asymptomatic carriers who may infect the community without awareness. Only if you have been tested, do you know if you been exposed or recovered from the virus. To reduce exposure to the virus, avoid the “Three C’s” — closed spaces with poor ventilation, crowded places and close contact—and do the following:
- Follow the public health guidelines:
-
- Social distance (physical distancing while continuing to offer social support)
- Wear a mask and gloves to reduce spreading the virus to others.
- Wash your hands with soap for at least 20 seconds.
- Avoid touching your face to prevent microorganisms and viruses to enter the body through mucosal surfaces of the nose mouth and eyes.
- Clean surfaces which could have been touched by other such as door bell, door knobs, packages.
- Avoid the person’s slipstream that may contain the droplets in the exhaled air. The purpose of social distancing is to have enough distance between you and another person so that the exhaled air of the other person would not reach you. The distance between people depends upon their activities and the direction of airflow.
In a simulation study, Professor Bert Blocken and his colleagues at KU Leuven and Eindhoven University of Technology reported that the plume of the exhaled air that potentially could contain the virus droplets could extend much more than 5 feet. It would depends upon the direction of the wind and whether the person is walking or jogging as show in Figure 1 (Blocken, 2020).

Figure 1. The plume of exhaled droplets that could contain the virus extends behind the person in their slipstream (photo from KU Leuven en TU Eindhoven).
The plume of exhaled droplets in the person’s slipstream may extend more than 15 feet while walking and more than 60 feet while jogging or bicycling. Thus. social distancing under these conditions is much more than 6 feet and it means avoiding their slipstream and staying much further away from the person.
- Increase fresh air to reduce virus concentration. The CDC recommends ventilation with 6 to 12 room air changes per hour for effective air disinfection (Nardell & Nathavitharana, 2020). By increasing the fresh outside air circulation, you dilute the virus concentration that may be shed by an infected asymptomatic or sick person (Qian & Zheng, 2018). Thus, if you are exposed to the virus, you may receive a lower dose and increase the probability that you experience a milder version of the disease. Almost all people who contract COVID-19 are exposed indoors to the virus. In the contact tracing study of 1245 confirmed cases in China, only a single outbreak of two people occurred in an outdoor environment (Qian et al, 2020). To increase fresh air (this assumes that outside air is not polluted), explore the following:
-
- Open the windows to allow cross ventilation through your house or work setting. One of the major reasons that the flu season spikes in the winter is that people congregate indoors to escape weather extremes. People keep their windows closed to conserve heat and reduce heating bill costs. Lack of fresh air circulation increases the viral density and risk of illness severity (Foster, 2014). See the superb graphic illustration by Bartzokas et al (Feb 26, 2021).in the New York Times of virus concentration in schools when the windows are opened. https://www.nytimes.com/interactive/2021/02/26/science/reopen-schools-safety-ventilation.html?smid=em-share
- Use an exhaust fans to ventilate a building. By continuously replacing the inside “stale” air with fresh outside air, the concentration of the virus in the air is reduced.
- Use High-efficiency particulate air (HEPA) air purifiers to filter the air within a room. These devices will filter out particles whose diameter is equal to 0.3 µ m. They will not totally filter out the virus; however, they will reduce it.
- Avoid buildings with recycled air unless the heating and air conditioning system (HAC) uses HEPA filters.
- Wear masks to protect other people and your community. The mask will reduce the shedding of the virus to others by people with COVID-19 or those who are asymptomatic carriers. This is superbly illustrated by Prather, Wang, & Schooley (2020) that not masking maximizes exposure, whereas universal masking results in the least exposure.

- Avoid long-term exposure to air pollution. People exposed to high levels of air pollution and fine particulate matter (PM2.5) are more at risk to develop chronic respiratory conditions and COVID-19 death rates. In the 2003 study of SARS, ecologic analysis conducted among 5 regions in China with 100 or more SARS cases showed that case fatality rate increased with the increment of air pollution index (Cui, Zhang, Froines, et al. , 2003). The higher the concentration of fine particulate matter (PM2.5), the higher the death rate (Conticini, Frediani, & Caro, 2020). As researchers, Xiao Wu, Rachel C. Nethery and colleagues (2020) from the Harvard T.H. Chan School of Public Health point out, “A small increase in long-term exposure to PM2.5 leads to a large increase in COVID-19 death rate, with the magnitude of increase 20 times that observed for PM2.5 and all cause mortality. The study results underscore the importance of continuing to enforce existing air pollution regulations to protect human health both during and after the COVID-19 crisis.“
- Breathe only through your nose. The nose filters, warms, moisturizes and slows the airflow so that airway irritation is reduced. Nasal breathing increases nitric oxide production that significantly increases oxygen absorption in the body. During inspiration through the nose the nitric oxide helps dilate the airways in your lungs and blood vessels (McKeown, 2016). More importantly for dealing with COVID-19, Nitric Oxide, produced and released inside the nasal cavities and the lining of the blood vessels, acts as an antiviral and a secondary strategy to protect against viral infections (Mehta, Ashkar & Mossman, 2012).
How to strengthen your immune system to fight the virus
The immune system is dynamic and many factors as well as individual differences affect its ability to fight the virus. It is possible that a 40 year-old person may have an immune systems that functions as a 70 year old, while some 70 year-olds have an immune system that function as a 40 year-old. Factors that contribute to immune competence include genetics, aging, previous virus exposure, and lifestyle (Lawton, 2020).
It is estimated that 70-80% mortality caused by Covid-19 occurred in people with comorbidity who are: over 65, male, lower socioeconomic status (SES), non white, overweight/obesity, cardiovascular heart disease, and immunocompromised. Although children comprised only a small percentage of the seriously ill patients, 83% of those children in the intensive care units had comorbidities and 60% were obese. The majority of contributing factors to comorbidities and obesity are the result of economic inequality and life style patterns such as the Western inflammatory diet (Shekerdemian et al, 2020; Zachariah, 2020; Pollan, 2020).
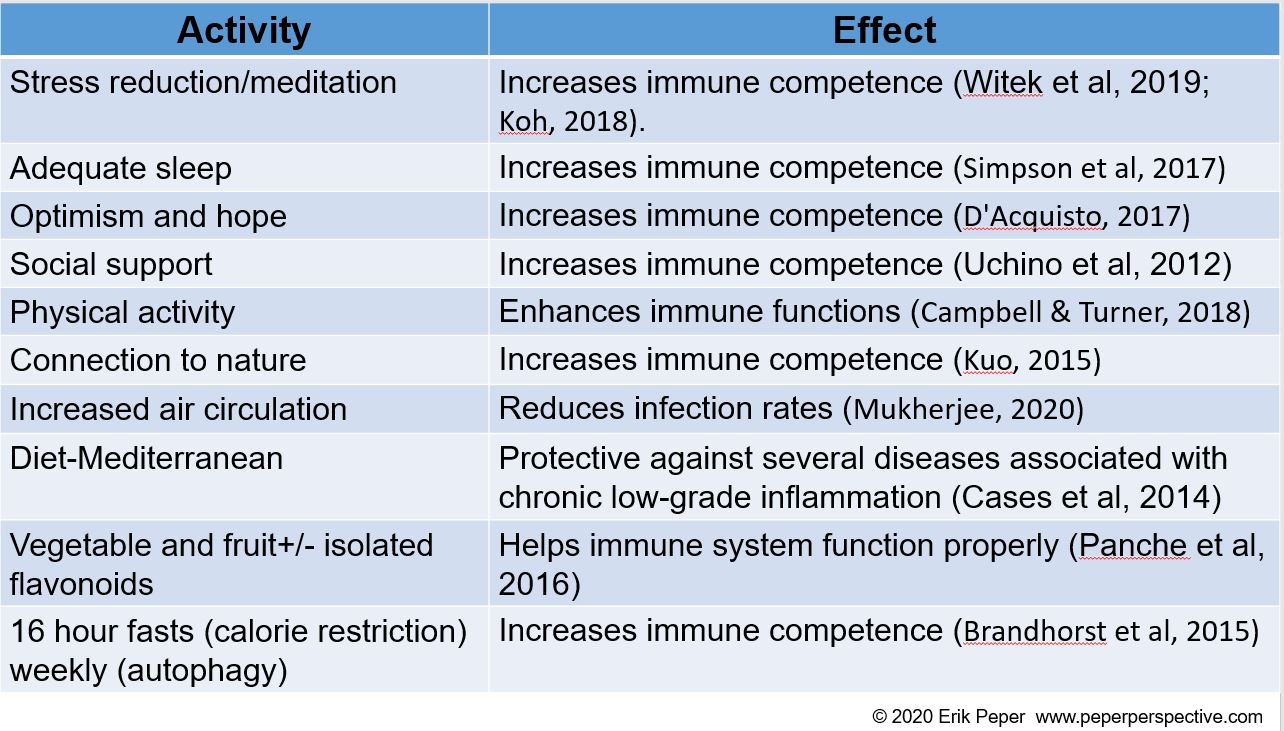
By taking charge of your lifestyle habits through an integrated approach, you may be able to strengthen your immune system (Alschuler et al, 2020; Lawton, 2020). The following tables, adapted from the published articles by Lawton (2020), Alschuler et al, (2020) and Jaffe (2020), list factors that support or decrease the immune system.
Factors that decrease immune competence

Factors that support immune competence
Phytochemicals and vitamins that support immune competence

REFERENCES
Abhanon, T. (2020 March 26). Practical tips how to keep yourself safe.
Foster, H. (2014 December 1). The reason for the season: why flu strikes in winter. SITN Science in the News.
Furukawa, N.W., Brooks, J.T., & Sobel, J. (2020, July). Evidence supporting transmission of severe acute respiratory syndrome coronavirus 2 while presymptomatic or asymptomatic. Emerg Infect Dis. [June3, 2020]. https://doi.org/10.3201/eid2607.201595
Ganyani, T., Kremer, C., Chen, D., Torneri, A, Faes, C., Wallinga, J., & Hensm N. (2020). Estimating the generation interval for COVID-19 based on symptom onset data doi:https://doi.org/10.1101/2020.03.05.20031815
Gaiha, S.M., Cheng, J. & Halpern-Felsher, B. (2020). Association between youth smoking, electronic cigarette use, and coronavirus disease 2019. Journal of Adolescent Health. Published online August 11, 2020. doi: https://doi.org/10.1016/j.jadohealth.2020.07.002
Heid, M. (2020-04-09). The Germ-Cleaning Power of an Open Window. Elemental by Medium.
BMJ Open, 11:e047474. http://dx.doi.org/10.1136/bmjopen-2020-047474
Jaffe, R. (2020). Reduce risk, boost immunity defense and repair abilities, and stay resilient. PERQUE Integrative Health.
Lawton, G. (2020). You’re only as young as your immune system. New Scientist, 245(3275), 44-48.
Lee, G. Y., & Han, S. N. (2018). The Role of Vitamin E in Immunity. Nutrients, 10(11), 1614.
Malaguarnera L. (2019). Influence of Resveratrol on the Immune Response. Nutrients, 11(5), 946.
Mukherjee, S. (2020). How does the coronavirus behave inside a patient? We’ve counted the viral spread across peoples; now we need to count it within people. The New Yorker, April 6, 2020.
Our food is not the same as 50 years ago
Posted: December 1, 2016 Filed under: Nutrition/diet, Uncategorized | Tags: diet, food, glyphosate, health, herbicides, immune system, nutrients 11 CommentsOur food should be our medicine and our medicine should be our food.– Hippocrates
Agribusiness appears to have overlooked Hippocrates’ advice in the quest for profits and quantity over quality. Over the last 50 years key nutrients of fruits and vegetables have declined. In a survey of 43 crops of fruits and vegetables, Davis, Epp, & Riordan, (2004) found a significant decrease of vitamins and minerals in foods grown in the 1950s as compared to now as shown in Figure 1 (Lambert, 2015).
Figure 1. Change in vitamins and minerals from 1950 to 1999. From: Davis, D. R., Epp, M. D., & Riordan, H. D. (2004). Changes in USDA food composition data for 43 garden crops, 1950 to 1999. Journal of the American College of Nutrition, 23(6), 669-682.
Not only are there fewer nutrients present in our fruits and vegetables, it is also laced/contaminated with pesticides and herbicides such as glyphosate. Glyphosate is the weedkiller, Roundup, produced by Monsanto and is now found in almost all non-organic foods as shown in Figure 2.
Figure 2. Example of foods tested for the presence of glyphosate. Reproduced with permission from https://s3.amazonaws.com/media.fooddemocracynow.org/images/FDN_Glyphosate_FoodTesting_Report_p2016.pdf
We are ingesting very low levels of glyphosate in most of our foods which may contribute to the development of illness. On March 20, 2015, the International Agency for Research on Cancer (IARC)–the specialized cancer agency of the World Health Organization–classified glyphosate as probably carcinogenic to humans (Group 2A). Glyphosate also affects our immune system and the healthy bacteria in our gut. Thus, I strongly recommend avoiding glyphosate and other types of herbicide and pesticide contaminated foods. By eating an organic food diet you can reduce pesticide and herbicide exposure by 90%. Unless you eat only organic foods, you will ingest more pesticides and herbicides at levels unacceptable by the European Union standards as shown in Figure 3.

Figure 3. Different allowable daily intake levels of glyphosate in the European Union as compared to the United States. Reproduced with permission from https://s3.amazonaws.com/media.fooddemocracynow.org/images/FDN_Glyphosate_FoodTesting_Report_p2016.pdf
Read the article Glyphosate: Unsafe on any plate: Alarming levels of Monstao’s gyphosate found in popular American foods. It describes the scientific evidence that at even at ultra-low levels of glyphosate e.g. 0.1 parts per billions (ppb) harm to human health could begin and how much of the foods contain glyphosate. The Executive Summary is reproduced with permission below:
Executive Summary
A leading FDA-registered food safety testing laboratory has found extremely high levels of the pesticide glyphosate in some of America’s most popular food products. Glyphosate, the active ingredient in Monsanto’s Roundup, is the most heavily used chemical weedkiller in food and agricultural production in human history, as a result of the widespread adoption of genetically engineered crops now grown on more than 175 million acres in the United States (U.S.) and more than 440 million acres around the globe.
New scientific evidence shows that probable harm to human health could begin at ultra-low levels of glyphosate e.g. 0.1 parts per billions (ppb). Popular foods tested for glyphosate measured between 289.47 ppb and at levels as high as 1,125.3 ppb. The testing and analysis was performed by Anresco Laboratories, San Francisco, an FDA registered laboratory that has performed expert food safety testing since 1943.
The laboratory found that well-known products tested for glyphosate, Original Cheerios, for example, measured levels as high as 1,125.3 ppb. Other high levels of glyphosate were found in familiar products such as Oreos, Doritos, and Ritz Crackers, among 29 foods tested. Currently, U.S. regulators allow a very high level of daily glyphosate residue in America’s food. The acceptable daily intake (ADI) limit is set at 1.75 milligrams per kilogram of bodyweight per day (written 1.75 mg/kg bw/day) in the U.S., versus a more cautious 0.3 mg/kg bw/day in the European Union. Tolerances have been set through the submission of corporate-sponsored studies and industry influence on the regulatory process.
New research shows that Roundup causes liver and kidney damage in rats as reflected in changes in the functions of 4,000 genes at only 0.05 parts per billion (ppb) glyphosate equivalent indicating damage.2 Additional studies have found that levels as low as 10 ppb can have toxic effects on the livers of fish and cause significant damage to the livers and kidneys of rats at 700 ppb, which is the allowable level of glyphosate found in U.S. drinking water.
Credible independent, peer-reviewed scientific evidence now shows that the levels of harm to human health could begin at the ultra-low levels of 0.1 parts per billion (ppb) of glyphosate. These groundbreaking new findings that one of the most iconic cereals in U.S. contains levels as high as 1,125.3 ppb should be a wake-up call for all Americans regarding unacceptable levels of pesticide residues in our nation’s food. These findings are especially troubling, considering that the latest independent scientific evidence, during which a team of international scientists re-evaluated the same data previously used by regulators, calls for a much lower ADI to be set at 0.025 mg/ kg of bodyweight per day or “12 times lower than the ADI”6 currently set in Europe and 70 times lower than the level currently allowed by the EPA in the United States. It’s important for individuals and parents to understand that glyphosate contamination cannot be removed by washing and is not broken down by cooking or baking. Glyphosate residues can remain stable in food for a year or more, even if the foods are frozen or processed.
The testing and analysis was performed at the request of FOOD DEMOCRACY NOW!, in coordination with THE DETOX PROJECT, which gathered additional scientific evidence from around the world and included a compendium of independent research on glyphosate that contains Anresco Laboratory’s findings. Based on this new information, FOOD DEMOCRACY NOW! is calling for a federal investigation into the likely harmful effects of glyphosate on human health and the environment and is also seeking an investigation into the relationships between the regulators and the regulated industries, which has resulted in the public being exposed to levels of glyphosate which scientific studies show can be damaging to human health.
The complete article with references can be downloaded from: https://s3.amazonaws.com/media.fooddemocracynow.org/images/FDN_Glyphosate_FoodTesting_Report_p2016.pdf
References:
Davis, D. R., Epp, M. D., & Riordan, H. D. (2004). Changes in USDA food composition data for 43 garden crops, 1950 to 1999. Journal of the American College of Nutrition, 23(6), 669-682. https://doi.org/10.1080/07315724.2004.10719409
Lambert, C. (2015). If Food really better from the farm gate than super market shelf? New Scientist.228(3043), 33-37.
